

Get Access to
Website Insight Pro Report Template
Download, connect and use report template - Save time and skyrocket your campaign performance!
Actual Price: $499
👉 Today’s Price: $399 Only
You Save: 20% Off
🔗Connector Required
💵 Connector Cost: $9/account/month
🔒 Secure Checkout
Your information is 100% secure.
Payments are encrypted and safe.
⚠️Please note:
This is a one-time digital purchase and is Non-Refundable.

Get Access to Website Insight Pro Report Template
Pay once, use forever save time and skyrocket your campaign performance!
⚠️Please note: This is a one-time digital purchase and is Non-Refundable.
Actual Price: $499
👉 Today’s Price: $399 Only
You Save: 20% Off
Website Insight Pro Report Template
Achieve long-lasting success by turning raw Google Analytics, Search Console data into actionable in-depth insights with our custom-built professional Website Insight Pro reporting template.

Data Source

Actual Price: $499
👉 Today’s Price: $399 Only
You Save: 20% Off
🔗Connector Required
💵 Connector Cost: $9/account/month
Report Template Description
🔎 What Will You Understand After Purchasing This Report?
Google Analytics
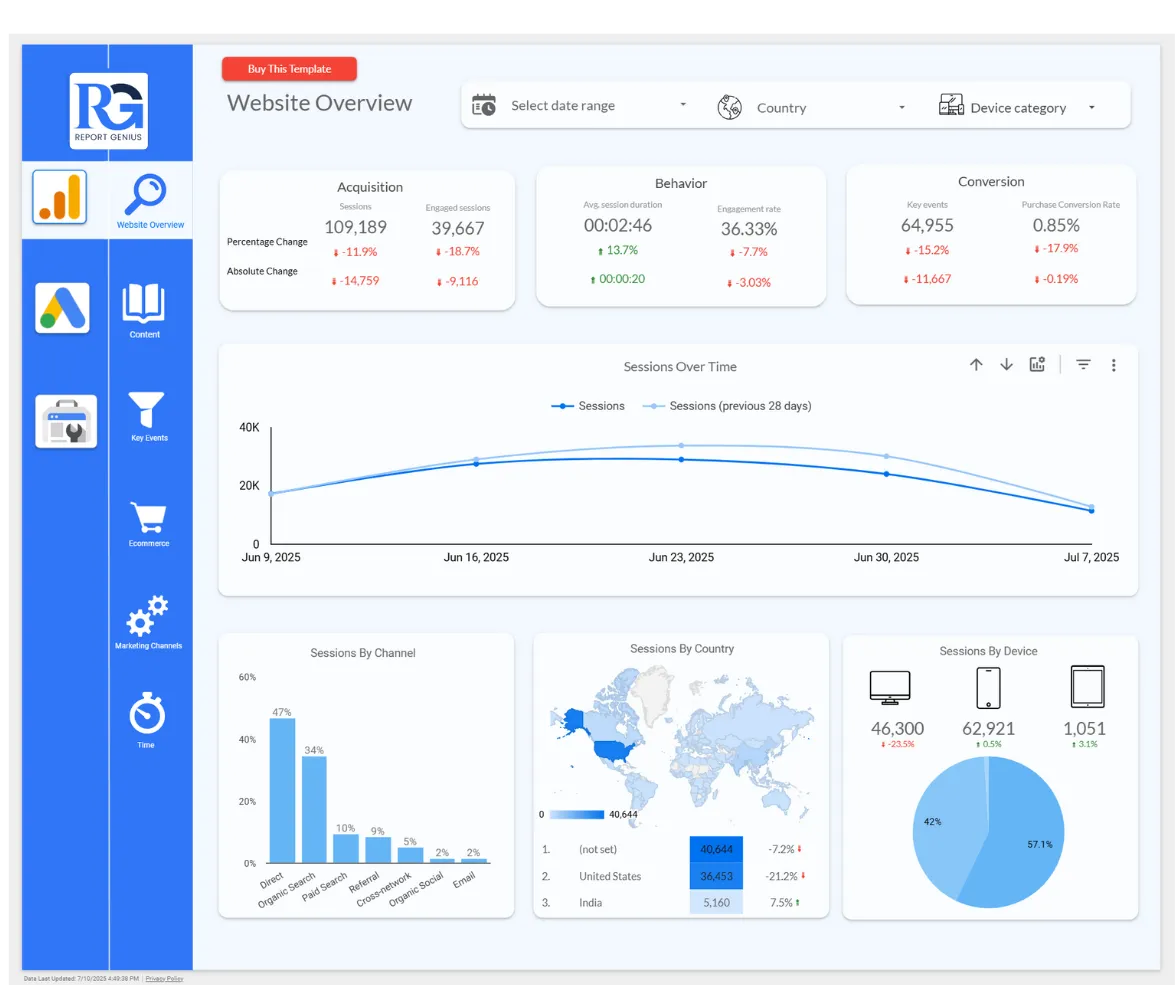
✅ Website Engagement & Acquisition
How many users are visiting your website, and how engaged they are.
Average session duration and engagement rate trends.
Where your sessions are coming from by channel, country, and device type.
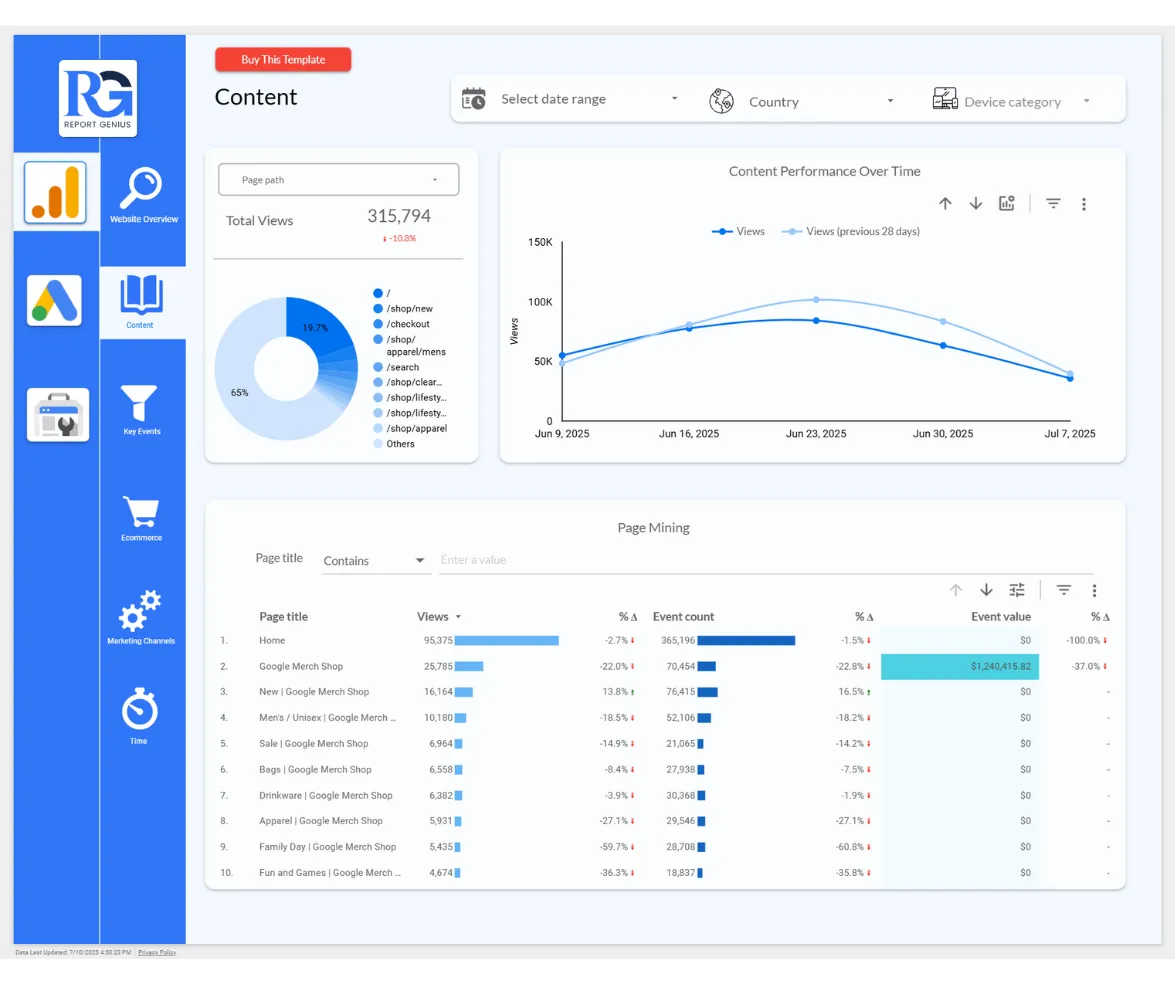
✅ Content Performance
Which pages get the most views.
How page-level performance changes over time.
Which pages drive the most event interactions and revenue.
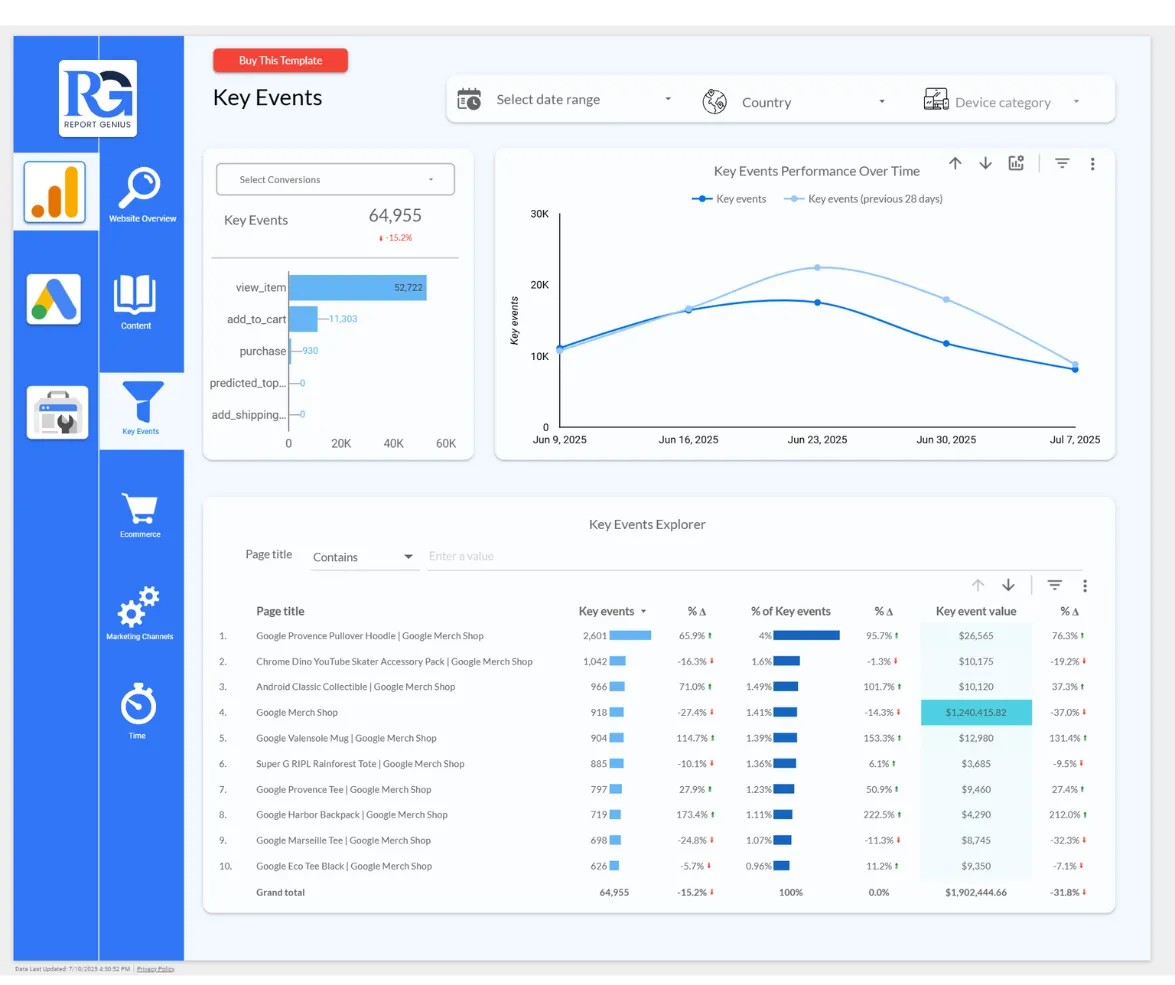
✅ Key Events & Conversions
How your critical conversions like view item, add to cart, purchase, checkout and other events perform over time.
Key events breakdown by page and event value.
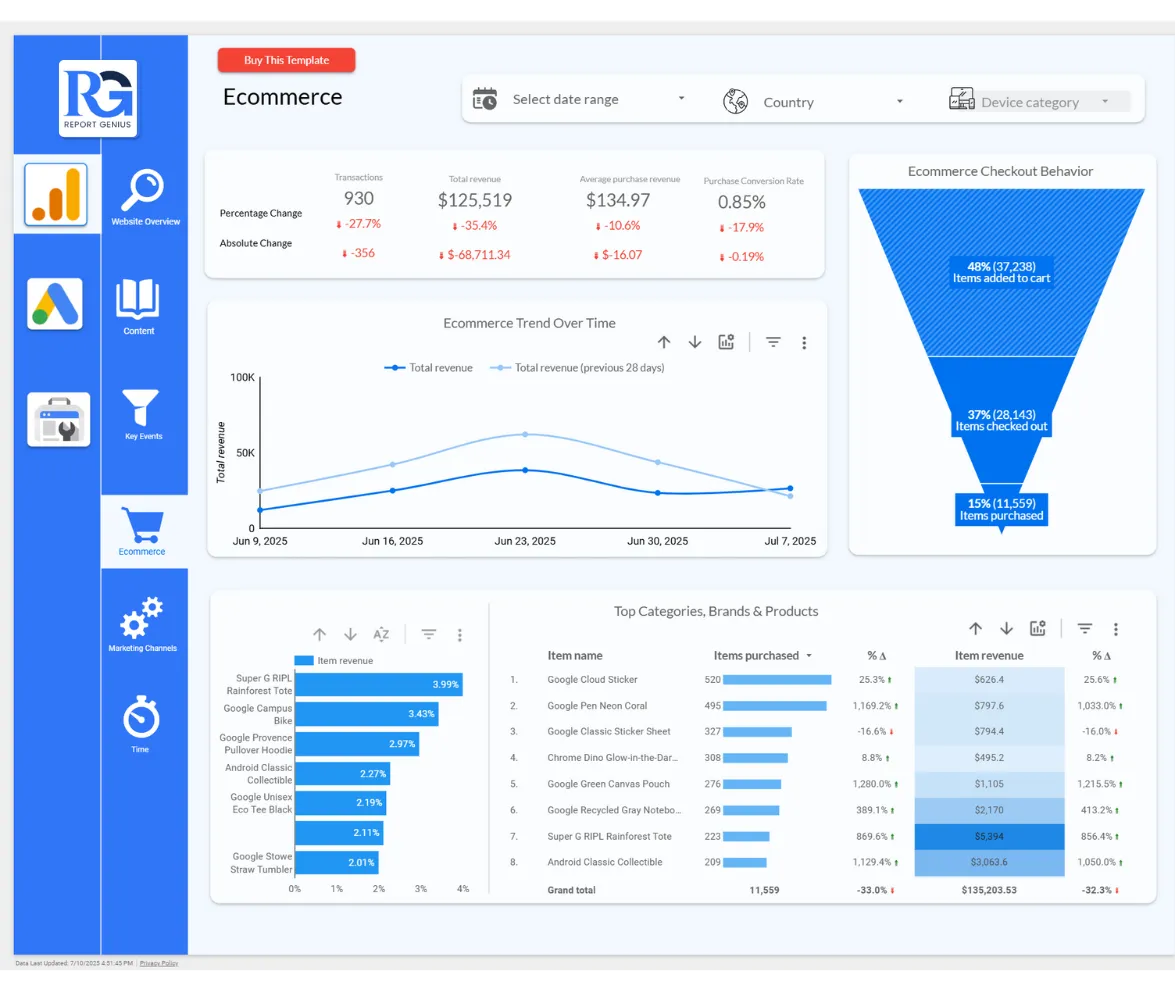
✅ Ecommerce Analysis
How revenue, transactions, and purchase conversion rates change over time.
Funnel performance: how many items added to cart, checked out, and purchased.
Top-performing products, brands, or categories by revenue and quantity.
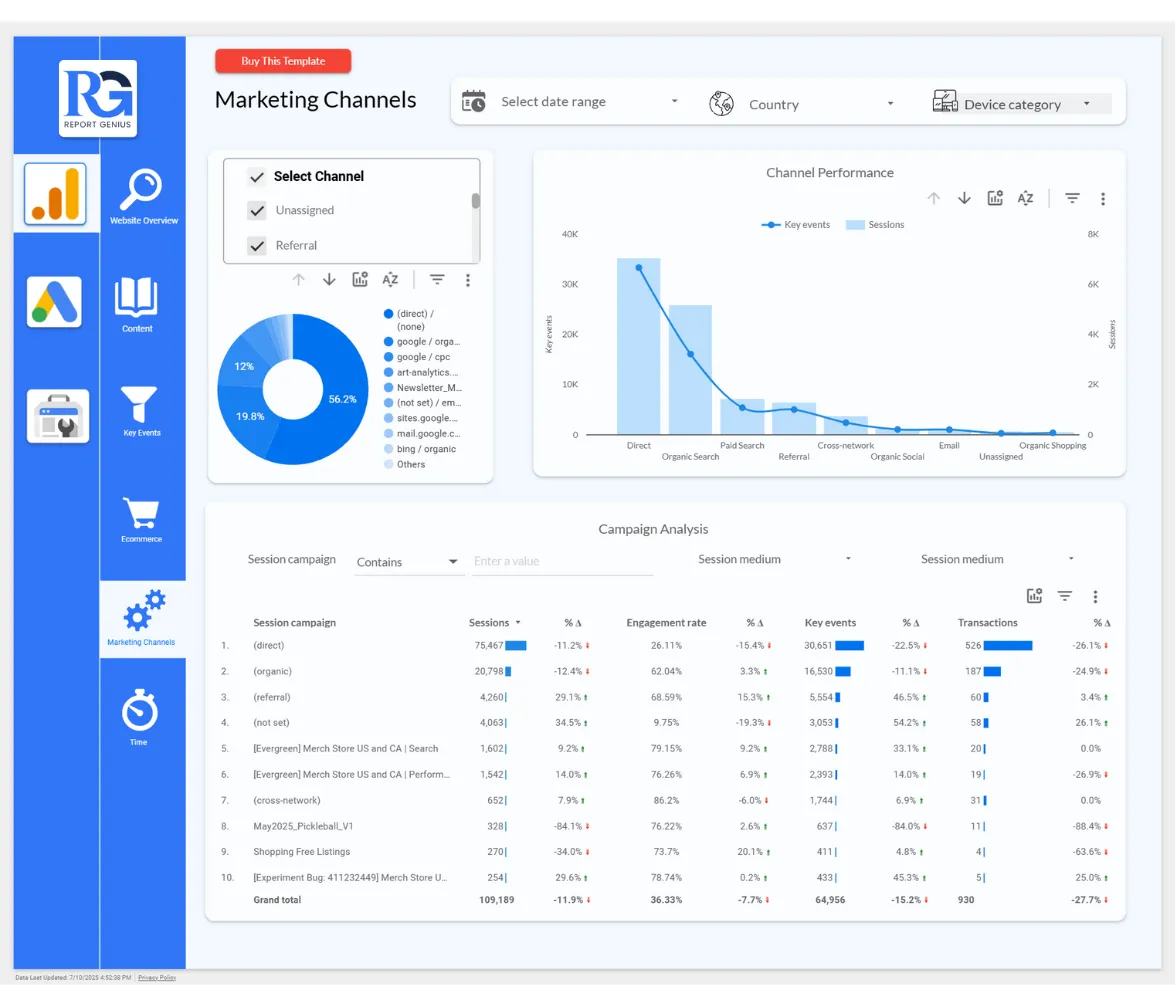
✅ Marketing Channels Effectiveness
Which marketing channels drive the most sessions, key events, and transactions.
Campaign performance with engagement and revenue breakdown.
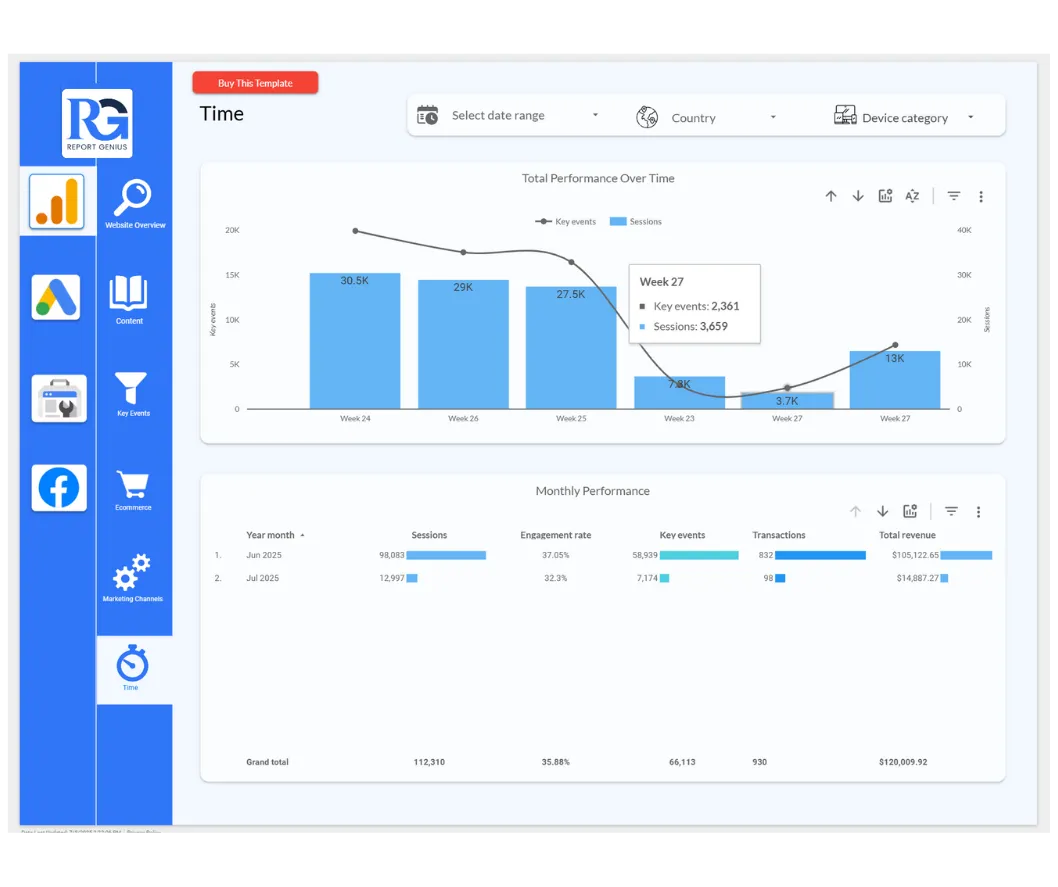
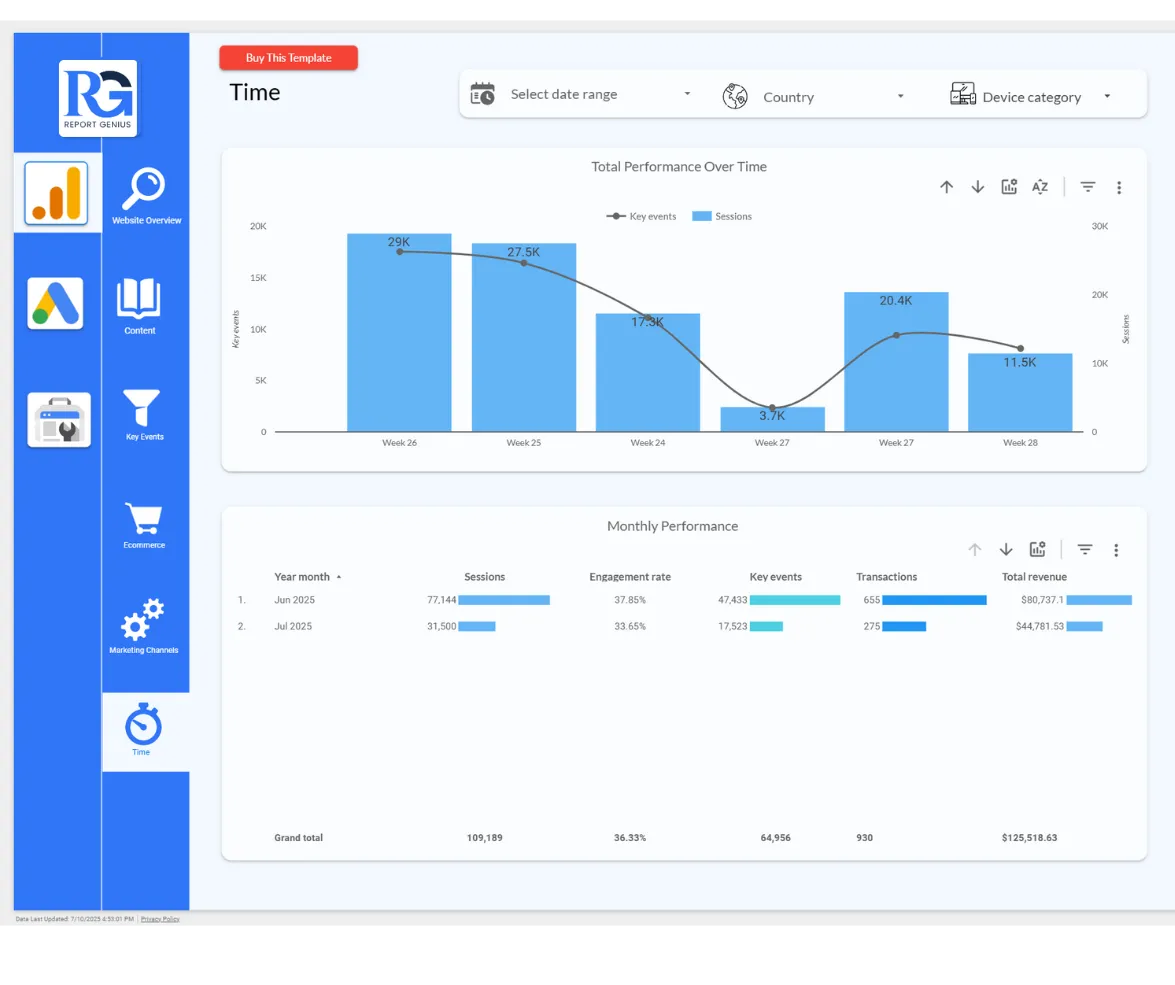
✅ Time-Based Trends
Week-by-week and month-by-month performance of sessions, engagement, events, transactions, and revenue.
Easily spot trends, seasonality, or campaign impacts.
📊 Metrics & Dimensions Included
Metrics:
✅Sessions
✅Engaged sessions
✅Avg. session duration
✅Engagement rate
✅Key events (total + breakdown by type)
✅Transactions
✅Total revenue
✅Average purchase revenue
✅Purchase conversion rate
✅Event count
✅Event value
✅Percentage & absolute changes (period-over-period)
Dimensions:
✅Channel (source/medium)
✅Country
✅Device category
✅Page path / Page title
✅Session campaign
✅Session medium
✅Item name (product-level details)
✅Year-month, week (for time analysis)
✨ Custom Metrics (Exclusive!)
This report includes calculated/custom metrics you won’t find in standard GA4 reports, such as:
Purchase Conversion Rate (%) – calculated to show the ratio of transactions to sessions.
Absolute & Percentage Changes for key metrics over previous periods — letting you see growth or decline instantly.
Engaged Sessions Metric – custom engagement calculation for deeper insights.
Custom Event Value Calculations – summing event value per page or item, not directly available in GA4.
Google Ads
✅ Ads Overview & Cost Analysis
How your ad clicks, impressions, and conversions are trending over time.
What's happening with your ad spend, CPC (cost-per-click), and CPA (cost-per-acquisition).
Identify sudden drops or spikes in performance to quickly assess campaign health.
✅ Campaign-Level Performance
Which campaigns deliver the highest number of conversions and at what cost.
Comparison of CPA, conversion rates, and spend across all your active campaigns.
Know which campaigns are wasting budget with no returns.
✅ Keyword Performance & Match Type Analysis
See which keywords drive conversions and which burn your budget.
Understand performance by match type (Exact, Phrase, Broad) to adjust bidding strategy.
Find top-performing and poor-performing keywords by CPA and quality score.
✅ Audience Insights & Targeting Effectiveness
Which audience lists (e.g., remarketing, in-market, affinity) are converting best.
Breakdown by audience type (website visitors, in-market, etc.) to improve targeting.
Get a clear picture of ROAS (Return on Ad Spend) by location and audience.
✅ Audience Insights & Targeting Effectiveness
How conversions differ across mobile, tablet, and desktop users.
Which countries or regions are producing results and where you're wasting money.
View CPA and conversion rate breakdown by geography and device type.
📊 Metrics & Dimensions Included
Metrics:
✅Clicks
✅Impressions
✅CTR (Click-Through Rate)
✅Conversions
✅Cost
✅Average CPC (Cost per Click)
✅CPA (Cost per Acquisition)
✅Conversion Rate
✅ROAS (Return on Ad Spend)
✅Average CPM
✅Keyword Quality Score
✅Monthly and Weekly Performance Metrics
✅Percentage and Absolute Change (MoM or Custom Period)
Dimensions:
✅Campaign
✅Search Keyword
✅Match Type (Phrase/Exact/Broad)
✅Device Category
✅Audience List Name
✅Audience Type (Affinity/In-market/Website visitors)
✅Country/Territory
✅Month, Week, Date
✅Campaign Type (Search/Display/Video)
✨ Custom Metrics (Exclusive!)
These metrics are custom-calculated using formulas and not available in standard Google Ads reports:
CPA (Cost per Acquisition) calculated directly using cost/conversions at various levels (keyword, campaign, audience).
ROAS (Return on Ad Spend) custom formula = revenue ÷ cost (not directly available in Ads dashboard).
Absolute & Percentage Change between current and previous periods for conversions, clicks, CPC, CPA — helps in identifying growth or drop instantly.
Conversion Breakdown by Event Type – includes non-standard events like Local Actions, Website Visits, Menu Views, giving granular insights.
Custom Audience Conversion Rate – tracks how well each retargeting or affinity audience performs.
Keyword Match Type CPA & ROI – derived metrics that blend campaign + keyword performance per match category..
Google Search Console
✅ Organic Performance Overview
Understand how your site is performing in Google Search:
Total impressions, clicks, CTR, and average position trends.
Changes in performance over time — both percentage and absolute values.
Filter performance by country, device type, and date range.
✅ Brand vs Generic Keyword Performance
Discover how well your branded terms perform compared to generic ones:
Breakdown of Brand vs Generic keywords by impressions and clicks.
Visual comparison of traffic patterns for each category.
Keyword-level performance insights (e.g. “monticello spa”, “terme monticello”).
✅ Keyword Length & Type Analysis
See how different keyword types perform:
Comparison between short-tail and long-tail keywords.
Engagement metrics like clicks, CTR, and average position by keyword type and length.
Identify keyword types driving the most valuable traffic.
✅ Top Performing Keywords
Find out which keywords rank on Page 1 (Top 3 positions) and drive traffic:
List of high-performing keywords with clicks, impressions, and average ranking position.
Spot low-hanging opportunities for SEO optimization.
See changes in ranking positions and their effects on CTR.
✅ Time-Based SEO Trends
Visualize performance over time for deeper strategic decisions:
Month-by-month breakdown of impressions, clicks, CTR, and ranking trends.
Spot trends, drops, or spikes related to seasonality or algorithm updates.
Compare performance across months or campaigns.
📊 Metrics & Dimensions Included
Metrics:
✅Impressions
✅Clicks
✅CTR (Click Through Rate)
✅Average Position
✅% Change (Period-over-period)
✅Absolute Change
✅Keyword Count
✅Device & Country-specific performance
Dimensions:
✅Keyword
✅Keyword Category (Brand / Generic)
✅Keyword Type (Short-tail / Long-tail)
✅Page Rank Group (Top 3, 4–10, etc.)
✅Date (Day, Week, Month)
✅Country
✅Device Category
✨ Custom Metrics (Exclusive to This Template!)
Keyword Category / Group CTR & Position: Segmented views for brand vs generic and keyword types.
Page Ranking Filter: Instantly view keywords ranking in top positions.
Position Delta & CTR Delta: Quickly understand growth or decline.
Keyword Length Segmentation: Analyze performance based on number of words per query.
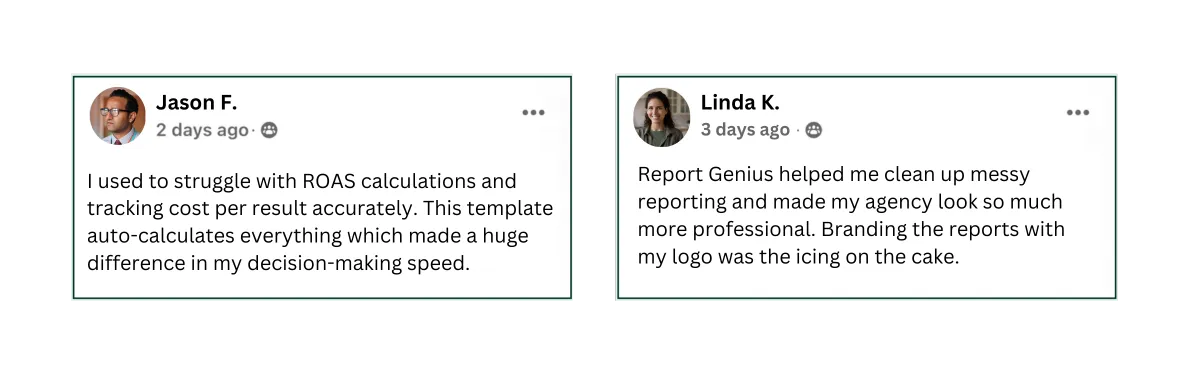
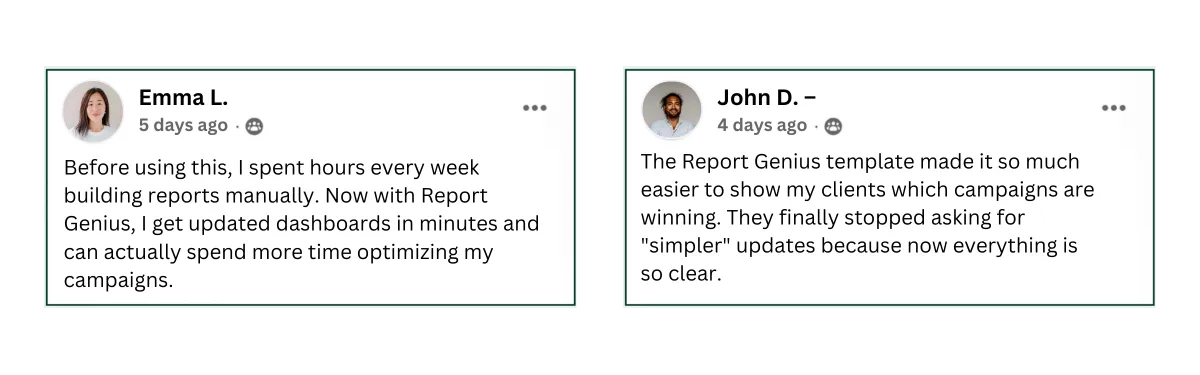
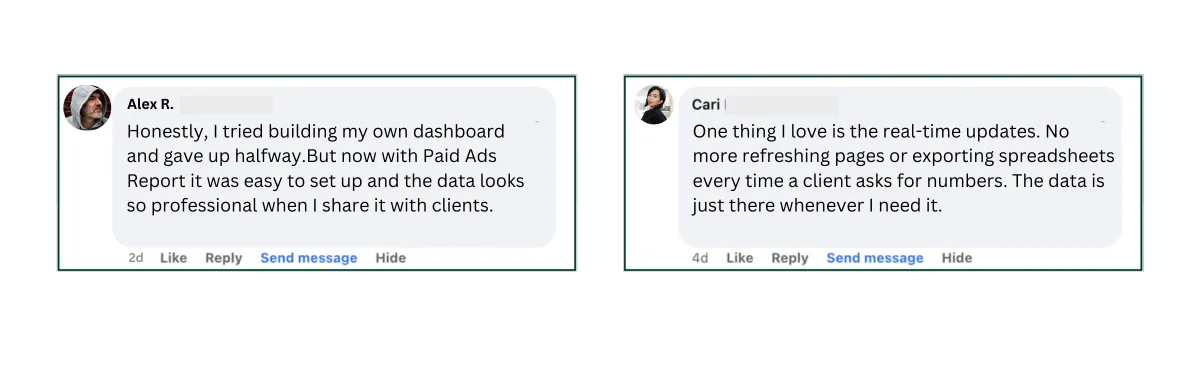
Our Client Reviews
Get Access to
Website Insight Pro Report Template
Download, connect and use report template - Save time and skyrocket your campaign performance!
Actual Price: $499
👉 Today’s Price: $399 Only
You Save: 20% Off
🔗Connector Required
💵 Connector Cost: $9/account/month
🔒 Secure Checkout
Your information is 100% secure.
Payments are encrypted and safe.
⚠️Please note:
This is a one-time digital purchase and is Non-Refundable.
Privacy Policy | Terms & Condition
Copyright: Start and Grow