

Get Access to
Google Ads & Facebook Ads Report Template
Download, connect and use report template - Save time and skyrocket your campaign performance!
Actual Price: $499
👉 Today’s Price: $249 Only
You Save: 50% Off
🔗Connector Required
💵 Connector Cost: $9/account/month
🔒 Secure Checkout
Your information is 100% secure.
Payments are encrypted and safe.
⚠️Please note:
This is a one-time digital purchase and is Non-Refundable.

Get Access to Google Ads & Facebook Ads Report Template
Pay once, use forever save time and skyrocket your campaign performance!
⚠️Please note: This is a one-time digital purchase and is Non-Refundable.
Actual Price: $499
👉 Today’s Price: $249 Only
You Save: 50% Off
Google Ads & Facebook Ads Report Template
Achieve long-lasting success by turning raw Google Ads and Facebook ads data into actionable in-depth insights with our custom-built professional Paid Ads reporting template.

Data Source

Actual Price: $499
👉 Today’s Price: $249 Only
You Save: 50% Off
🔗Connector Required
💵 Connector Cost: $9/account/month
Report Template Description
🔎 What Will You Understand After Purchasing This Report?
Google Ads
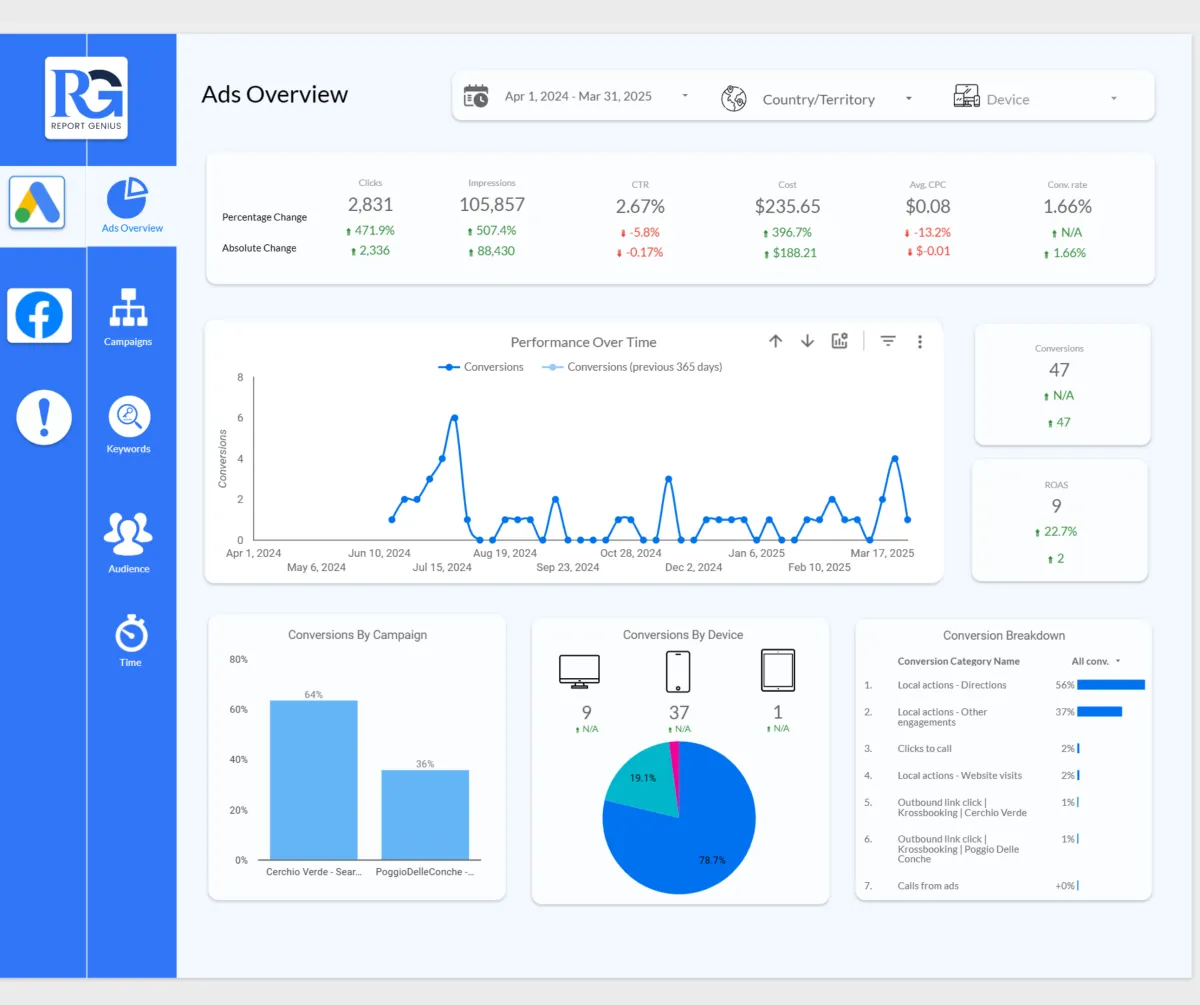
✅ Ads Overview & Cost Analysis
How your ad clicks, impressions, and conversions are trending over time.
What's happening with your ad spend, CPC (cost-per-click), and CPA (cost-per-acquisition).
Identify sudden drops or spikes in performance to quickly assess campaign health.
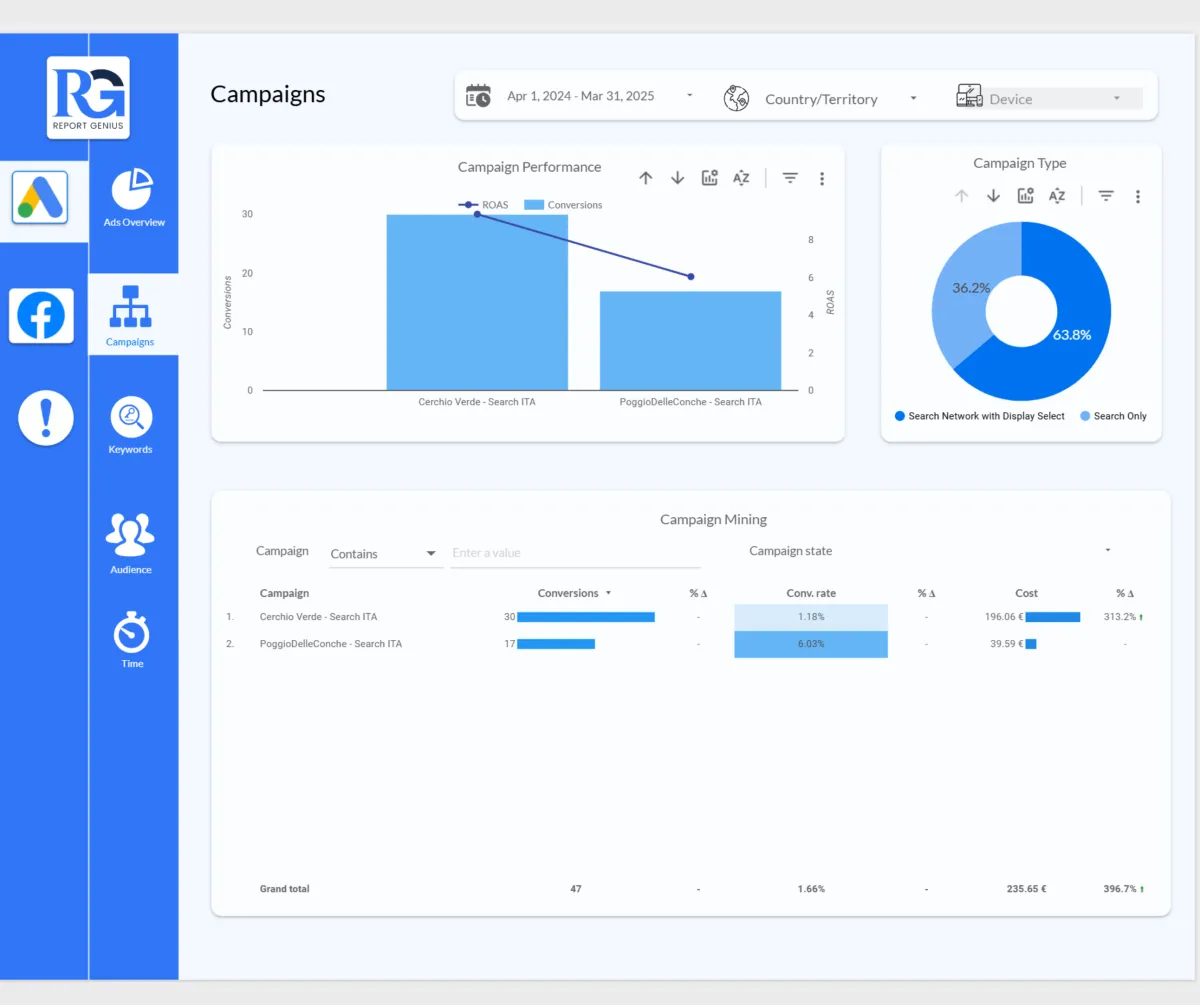
✅ Campaign-Level Performance
Which campaigns deliver the highest number of conversions and at what cost.
Comparison of CPA, conversion rates, and spend across all your active campaigns.
Know which campaigns are wasting budget with no returns.
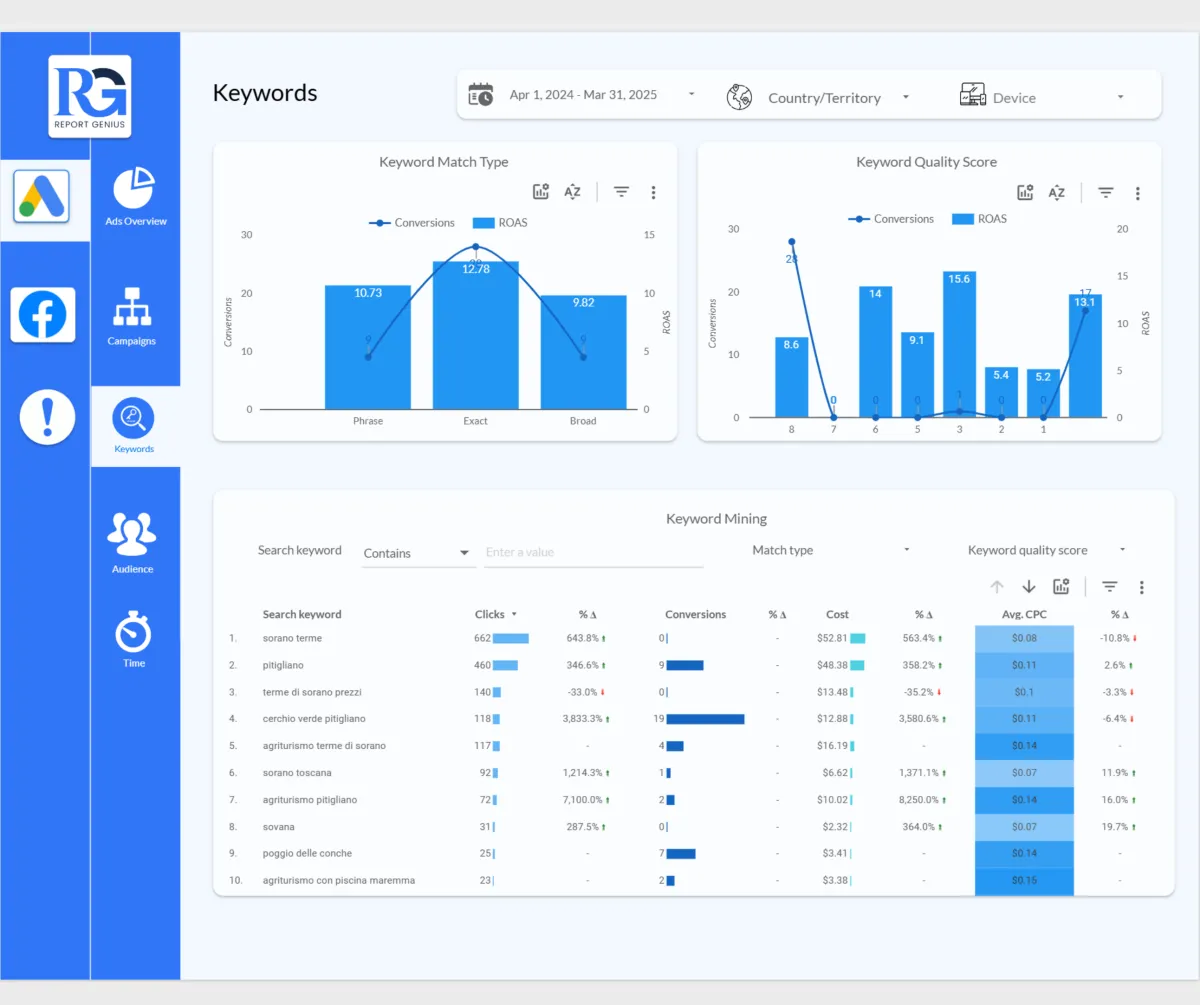
✅ Keyword Performance & Match Type Analysis
See which keywords drive conversions and which burn your budget.
Understand performance by match type (Exact, Phrase, Broad) to adjust bidding strategy.
Find top-performing and poor-performing keywords by CPA and quality score.
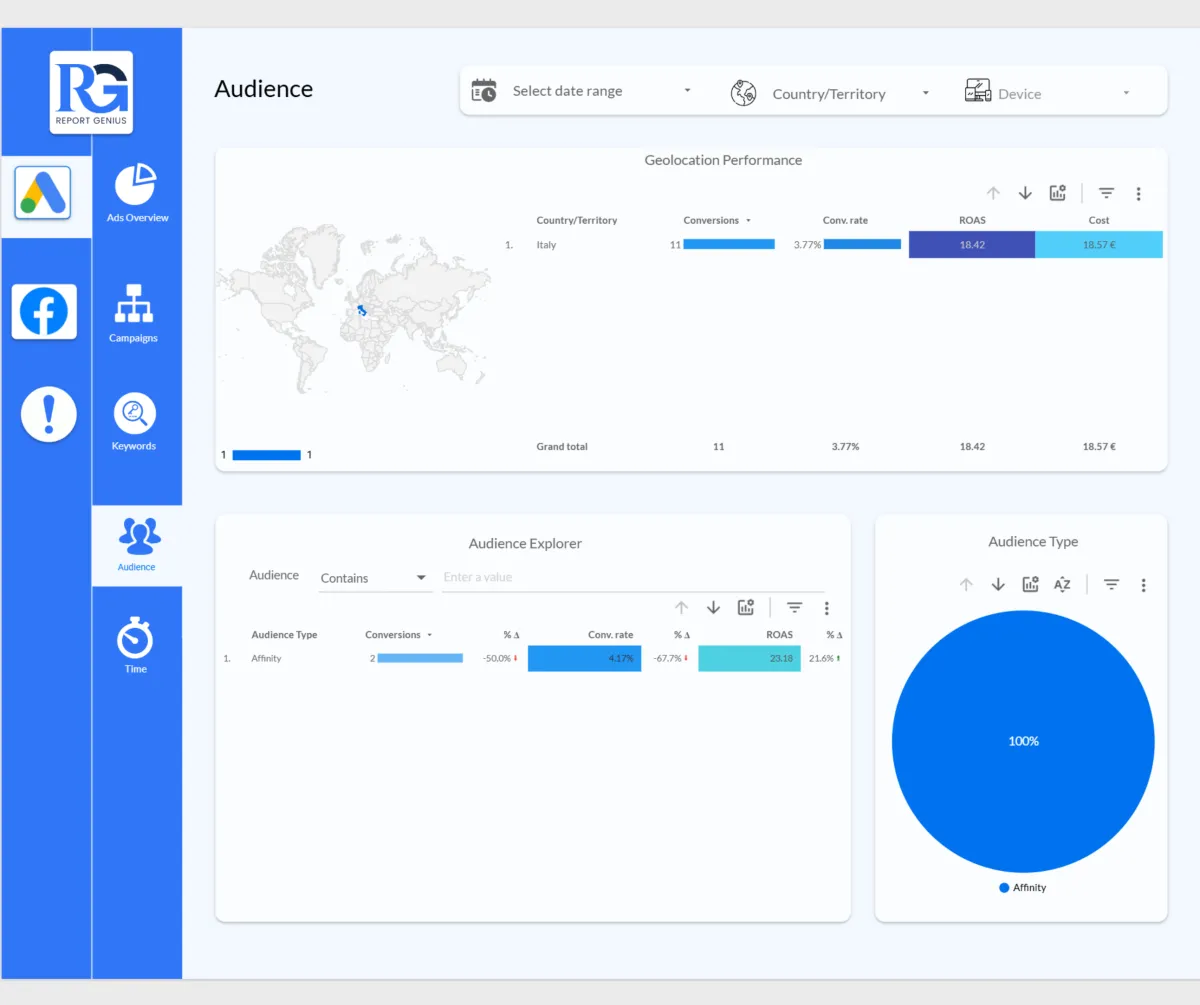
✅ Audience Insights & Targeting Effectiveness
Which audience lists (e.g., remarketing, in-market, affinity) are converting best.
Breakdown by audience type (website visitors, in-market, etc.) to improve targeting.
Get a clear picture of ROAS (Return on Ad Spend) by location and audience.
✅ Audience Insights & Targeting Effectiveness
How conversions differ across mobile, tablet, and desktop users.
Which countries or regions are producing results and where you're wasting money.
View CPA and conversion rate breakdown by geography and device type.
📊 Metrics & Dimensions Included
Metrics:
✅Clicks
✅Impressions
✅CTR (Click-Through Rate)
✅Conversions
✅Cost
✅Average CPC (Cost per Click)
✅CPA (Cost per Acquisition)
✅Conversion Rate
✅ROAS (Return on Ad Spend)
✅Average CPM
✅Keyword Quality Score
✅Monthly and Weekly Performance Metrics
✅Percentage and Absolute Change (MoM or Custom Period)
Dimensions:
✅Campaign
✅Search Keyword
✅Match Type (Phrase/Exact/Broad)
✅Device Category
✅Audience List Name
✅Audience Type (Affinity/In-market/Website visitors)
✅Country/Territory
✅Month, Week, Date
✅Campaign Type (Search/Display/Video)
✨ Custom Metrics (Exclusive!)
These metrics are custom-calculated using formulas and not available in standard Google Ads reports:
CPA (Cost per Acquisition) calculated directly using cost/conversions at various levels (keyword, campaign, audience).
ROAS (Return on Ad Spend) custom formula = revenue ÷ cost (not directly available in Ads dashboard).
Absolute & Percentage Change between current and previous periods for conversions, clicks, CPC, CPA — helps in identifying growth or drop instantly.
Conversion Breakdown by Event Type – includes non-standard events like Local Actions, Website Visits, Menu Views, giving granular insights.
Custom Audience Conversion Rate – tracks how well each retargeting or affinity audience performs.
Keyword Match Type CPA & ROI – derived metrics that blend campaign + keyword performance per match category..
Facebook Ads
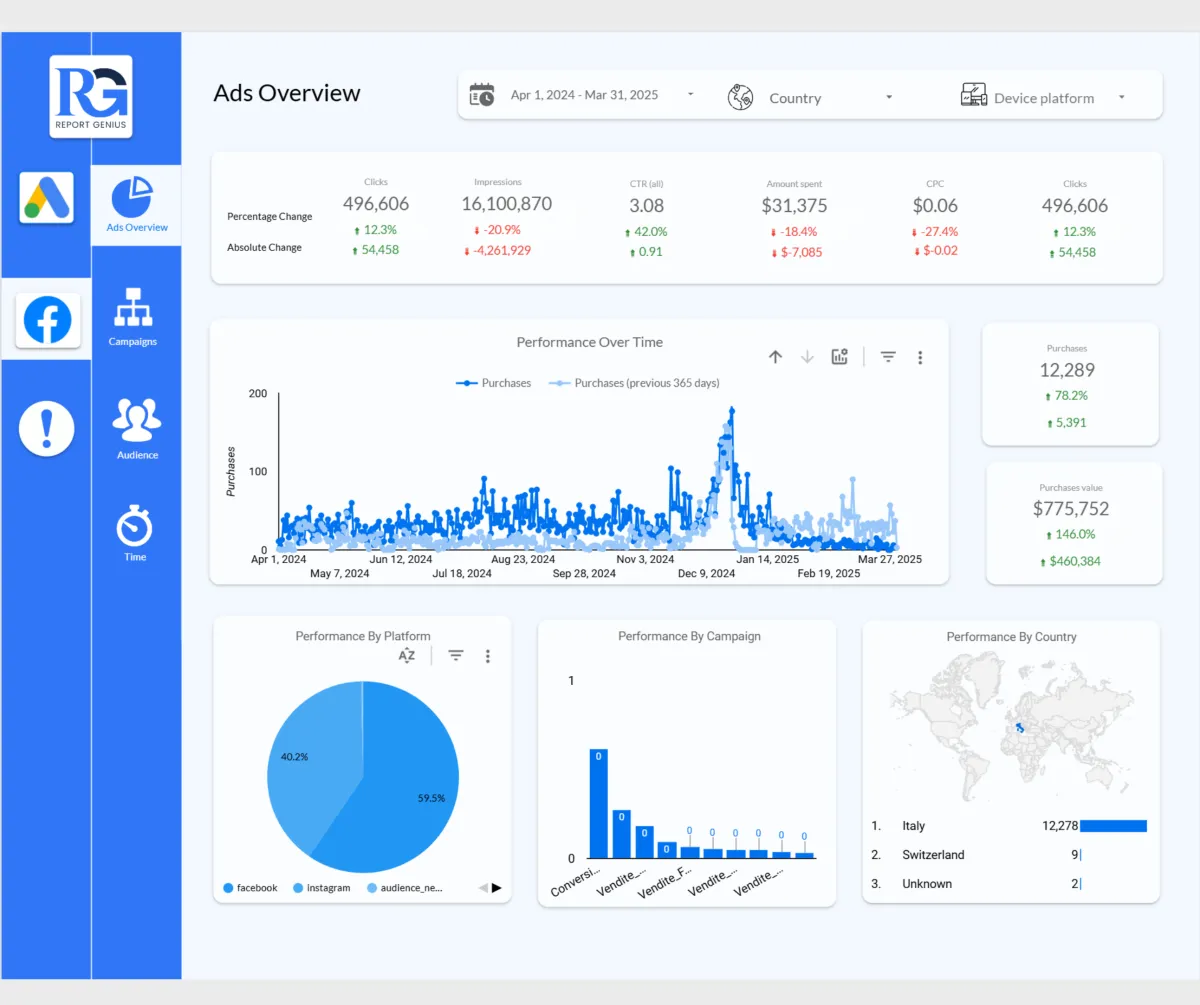
✅ Facebook Ads Overview
Get a high-level summary of your entire ad account’s performance:
Key metrics: clicks, impressions, CTR, CPC, amount spent, purchases, conversion rate, and CPA.
Analyze percentage and absolute change in performance compared to previous periods.
Spot trends with daily purchase tracking and historical comparisons.
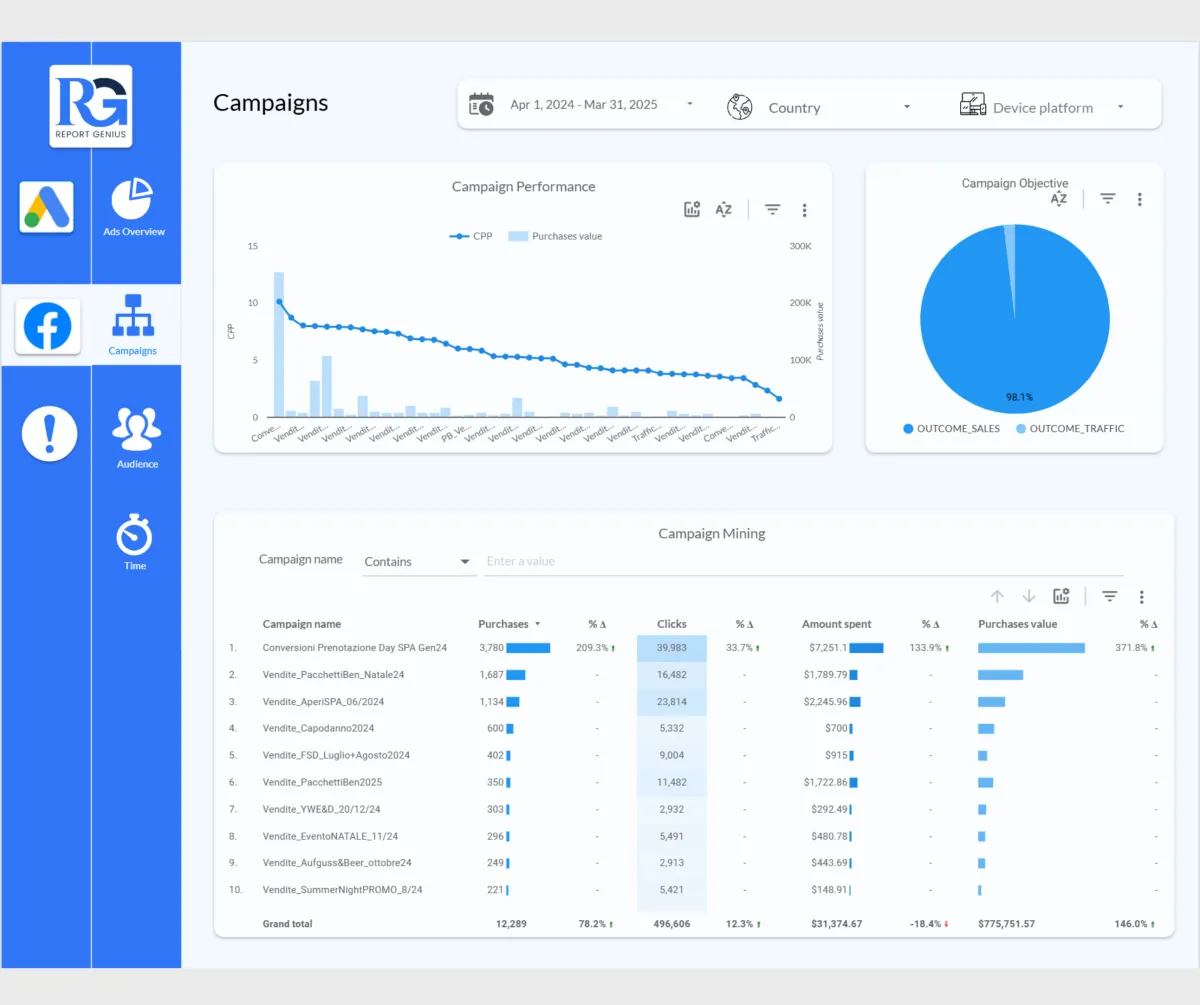
✅ Campaign Performance
Identify your top and bottom-performing campaigns instantly:
Campaign-level data: purchases, conversion rate, CPA, and spend.
Visualize performance with CPA vs. conversion rate charts.
Segment campaigns by objective (Sales vs Traffic) to evaluate strategy.
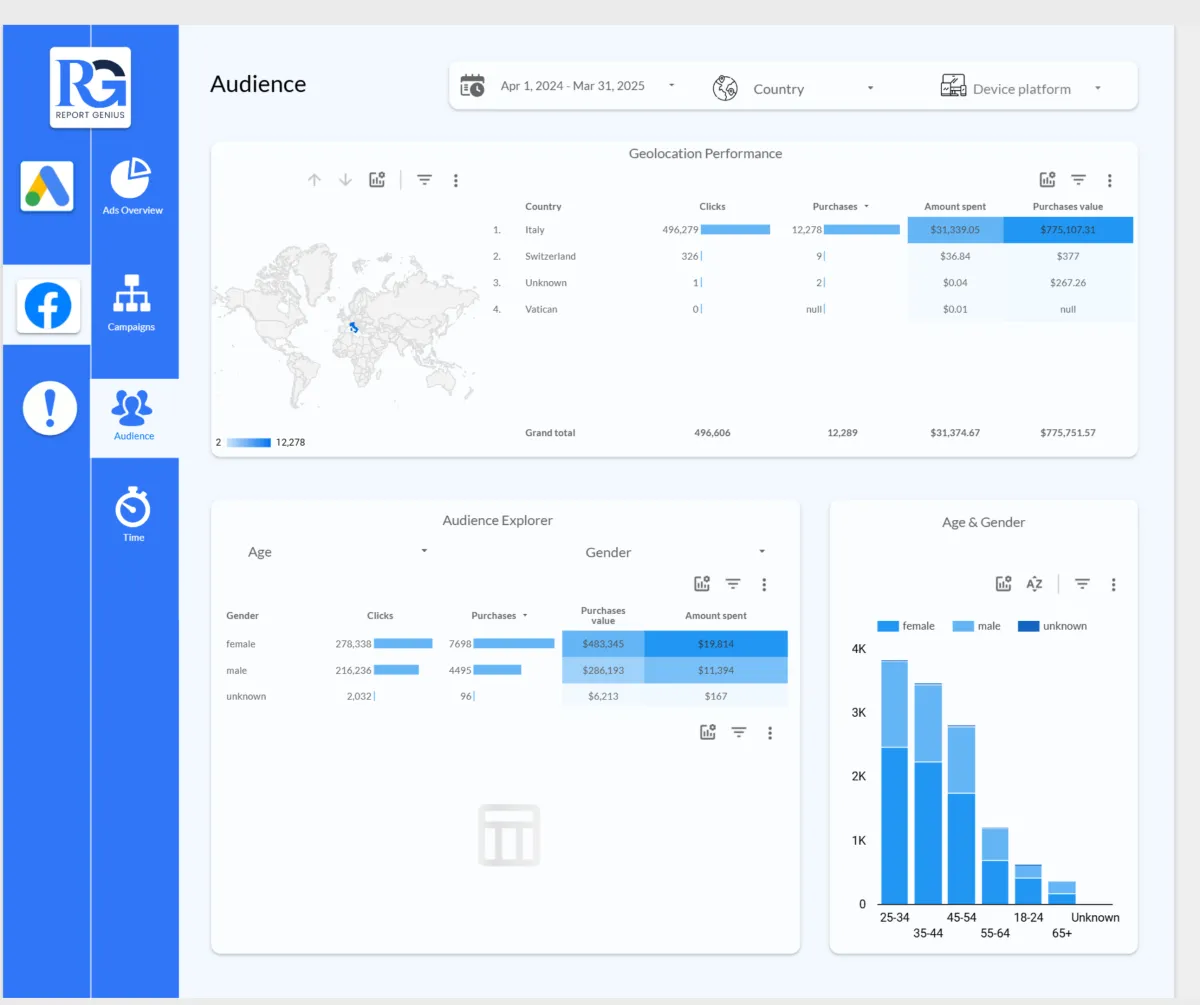
✅ Audience Analysis
Understand which audiences drive the best results:
Performance by age, gender, and country.
Cost-efficiency insights with CPA and conversion rate by demographic group.
Visual breakdown of audience segments to guide ad targeting and messaging.
✅ Platform Comparison
Track performance across Facebook, Instagram, and other placements:
See which platforms generate the most purchases and engagement.
Easily compare performance share by platform using intuitive visuals.
Optimize your budget allocation with platform-level CPA and ROI insights.
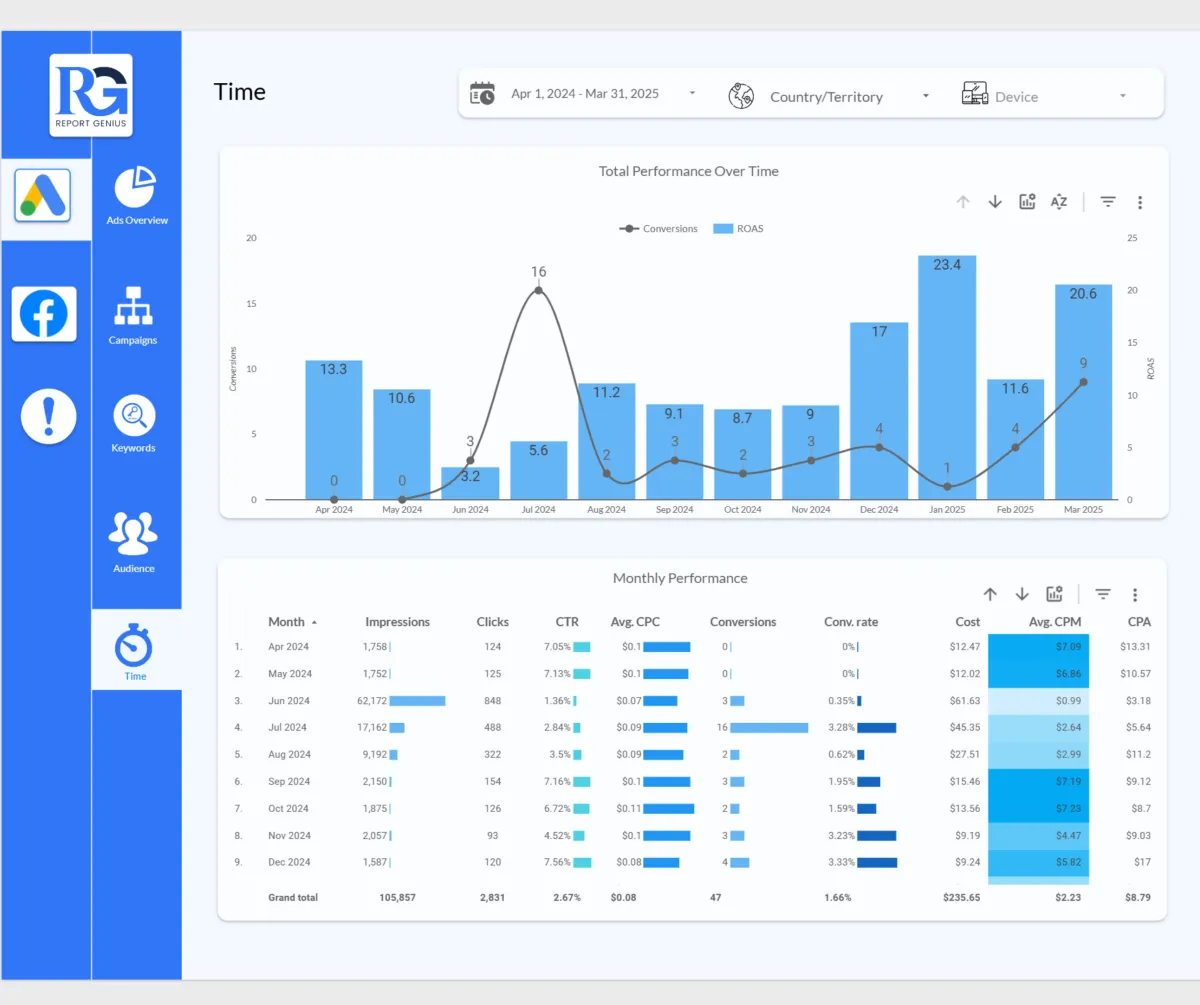
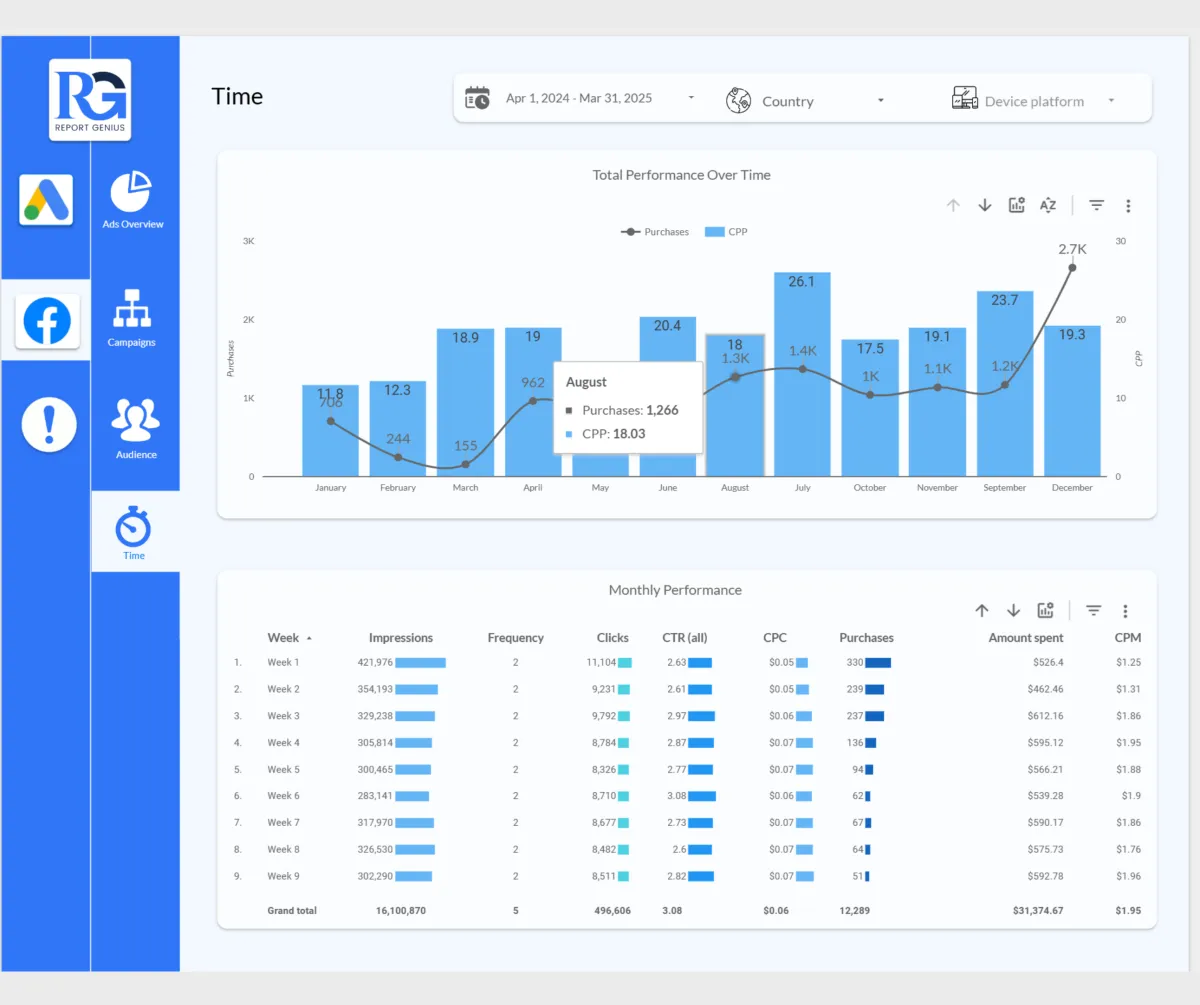
✅ Time-Based Ad Trends
Visualize how your campaigns evolve over time:
Weekly trends in clicks, impressions, purchases, CPA, and conversion rate.
Spot high-ROI periods and understand campaign lifecycle performance.
Track frequency and ad fatigue indicators over weeks.
📊 Metrics & Dimensions Included
Metrics:
✅Impressions
✅Clicks
✅CTR (Click-Through Rate)
✅CPC (Cost per Click)
✅CPA (Cost per Acquisition)
✅Amount Spent
✅Conversion Rate
✅Purchases
✅Frequency
✅% Change & Absolute Change (vs. previous period)
Dimensions:
✅Campaign Name
✅Campaign Objective (Sales / Traffic)
✅Platform (Facebook / Instagram)
✅Country
✅Device Platform
✅Gender
✅Age Group
✅Week / Month (for time-based analysis)
✨ Custom Metrics (Exclusive to This Template!)
Campaign Mining Table: Combine purchases, CPA, and ROI in one view.
Weekly Frequency Monitoring: Identify if audience fatigue is setting in.
CPA Heatmaps by Demographic: Instantly detect costly segments.
Performance vs. Previous Period Line Charts: Quick visual comparison to past results.
Our Client Reviews
Get Access to
Google Ads & Facebook Ads Report Template
Download, connect and use report template - Save time and skyrocket your campaign performance!
Actual Price: $499
👉 Today’s Price: $249 Only
You Save: 50% Off
🔗Connector Required
💵 Connector Cost: $9/account/month
🔒 Secure Checkout
Your information is 100% secure.
Payments are encrypted and safe.
⚠️Please note:
This is a one-time digital purchase and is Non-Refundable.
Privacy Policy | Terms & Condition
Copyright: Start and Grow