

Get Access to Your Facebook Ads Report Template
Pay once, use forever save time and skyrocket your campaign performance!
⚠️Please note: This is a one-time digital purchase and is Non-Refundable, Tracking not included.
Pay Once. Use Forever
👉 Price: $199 Only
Limited-Time Offer!

Get Access to
Facebook Ads Report Template
Download, connect and use report template - Save time and skyrocket your campaign performance!
Actual Price: $199
👉 Today’s Price: $99 Only
You Save: 50% Off
🔗Connector Required
💵 Connector Cost: $9/account/month
🔒 Secure Checkout
Your information is 100% secure.
Payments are encrypted and safe.
⚠️Please note:
This is a one-time digital purchase and is Non-Refundable.
Facebook Ads Report Template
Achieve long-lasting success by turning raw Facebook Ads or meta data into actionable in-depth insights with our custom-built professional Facebook Ads reporting template.

Data Source

Pay Once. Use Forever
👉 Price: $199 Only
Limited-Time Offer!
🔗Connector Required
💵 Connector Cost: Free
Note: Tracking not included
Report Template Description
🔎 What Will You Understand After Purchasing This Report?
Facebook Ads
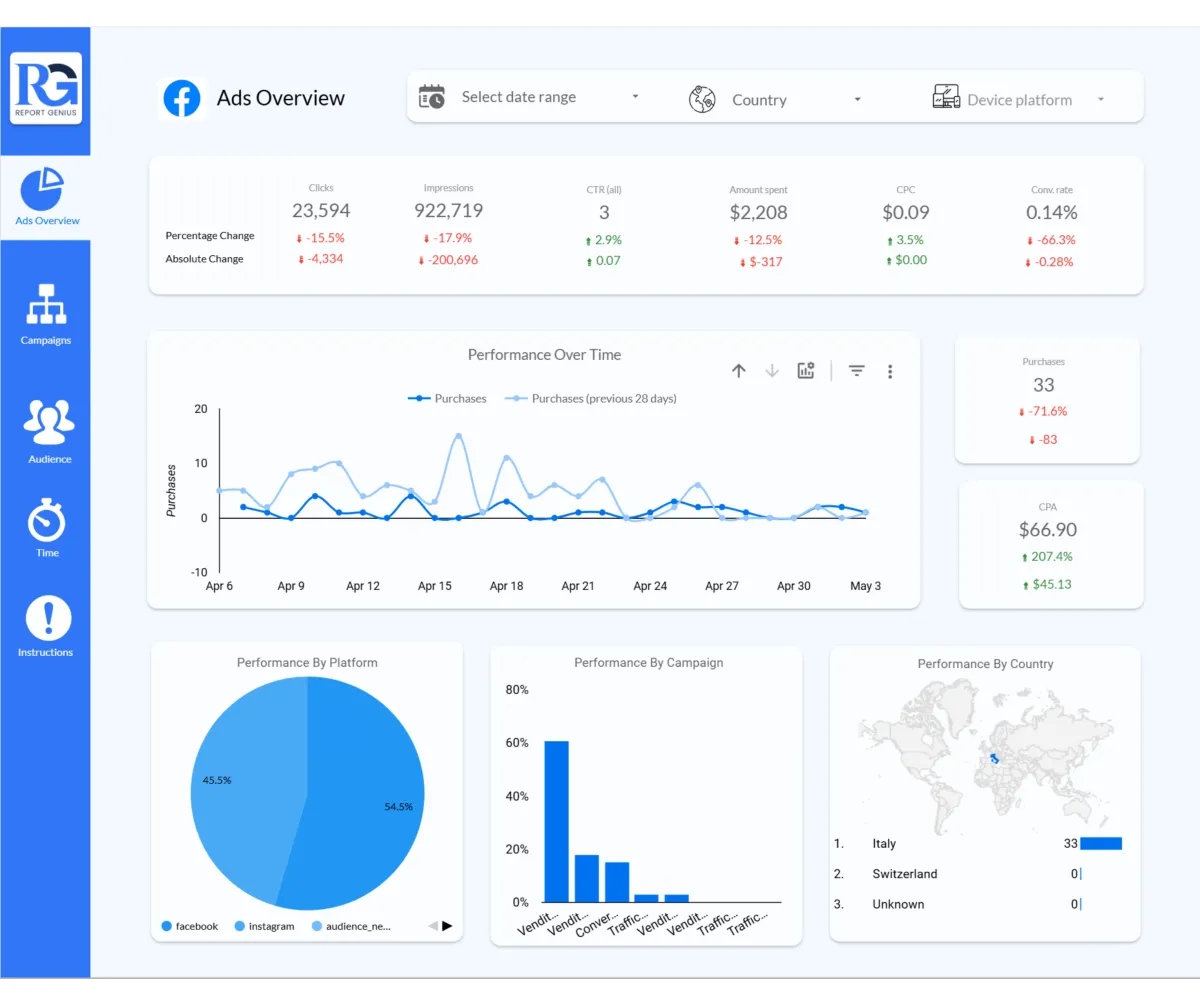
✅ Facebook Ads Overview
Get a high-level summary of your entire ad account’s performance:
Key metrics: clicks, impressions, CTR, CPC, amount spent, purchases, conversion rate, and CPA.
Analyze percentage and absolute change in performance compared to previous periods.
Spot trends with daily purchase tracking and historical comparisons.
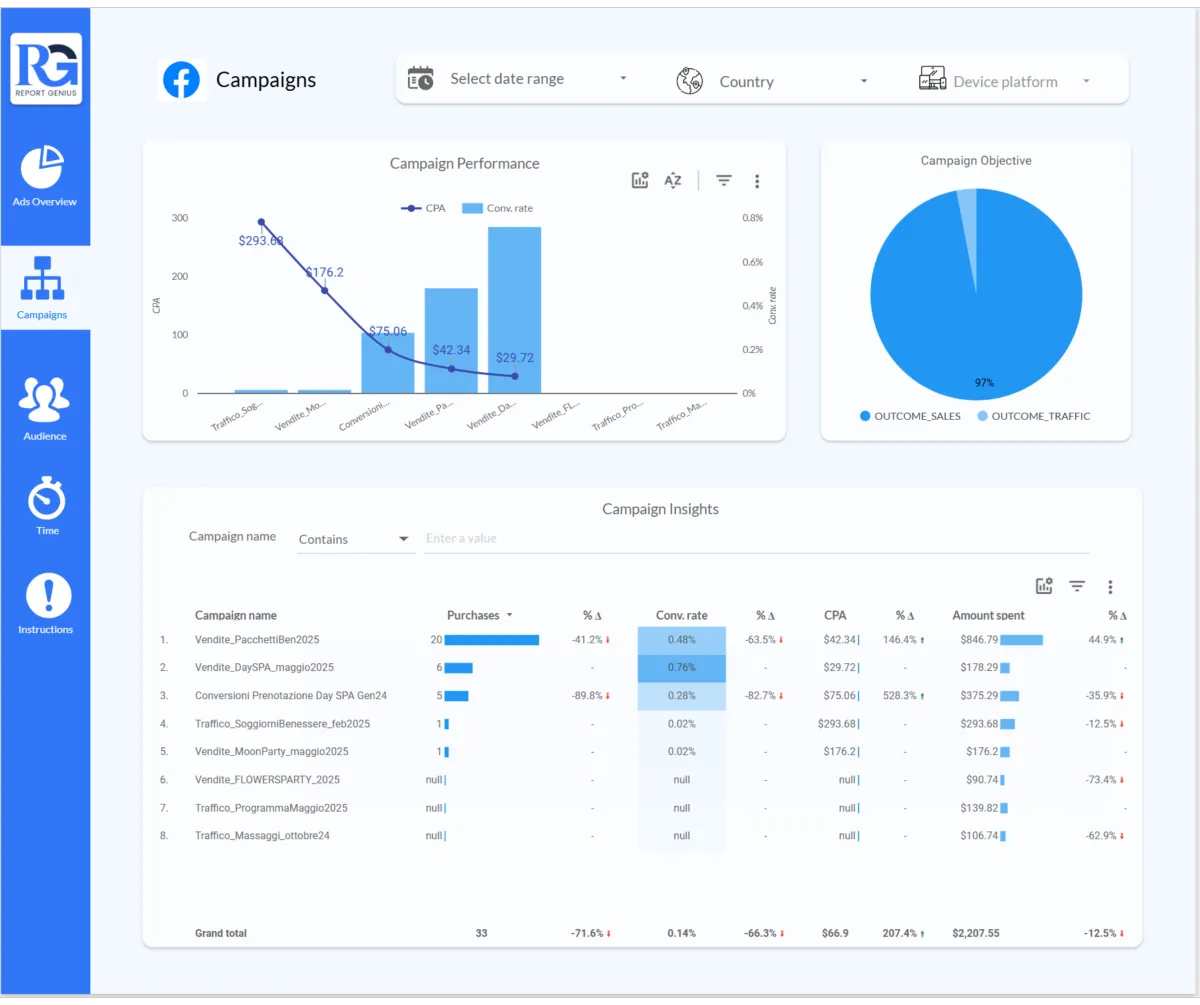
✅ Campaign Performance
Identify your top and bottom-performing campaigns instantly:
Campaign-level data: purchases, conversion rate, CPA, and spend.
Visualize performance with CPA vs. conversion rate charts.
Segment campaigns by objective (Sales vs Traffic) to evaluate strategy.
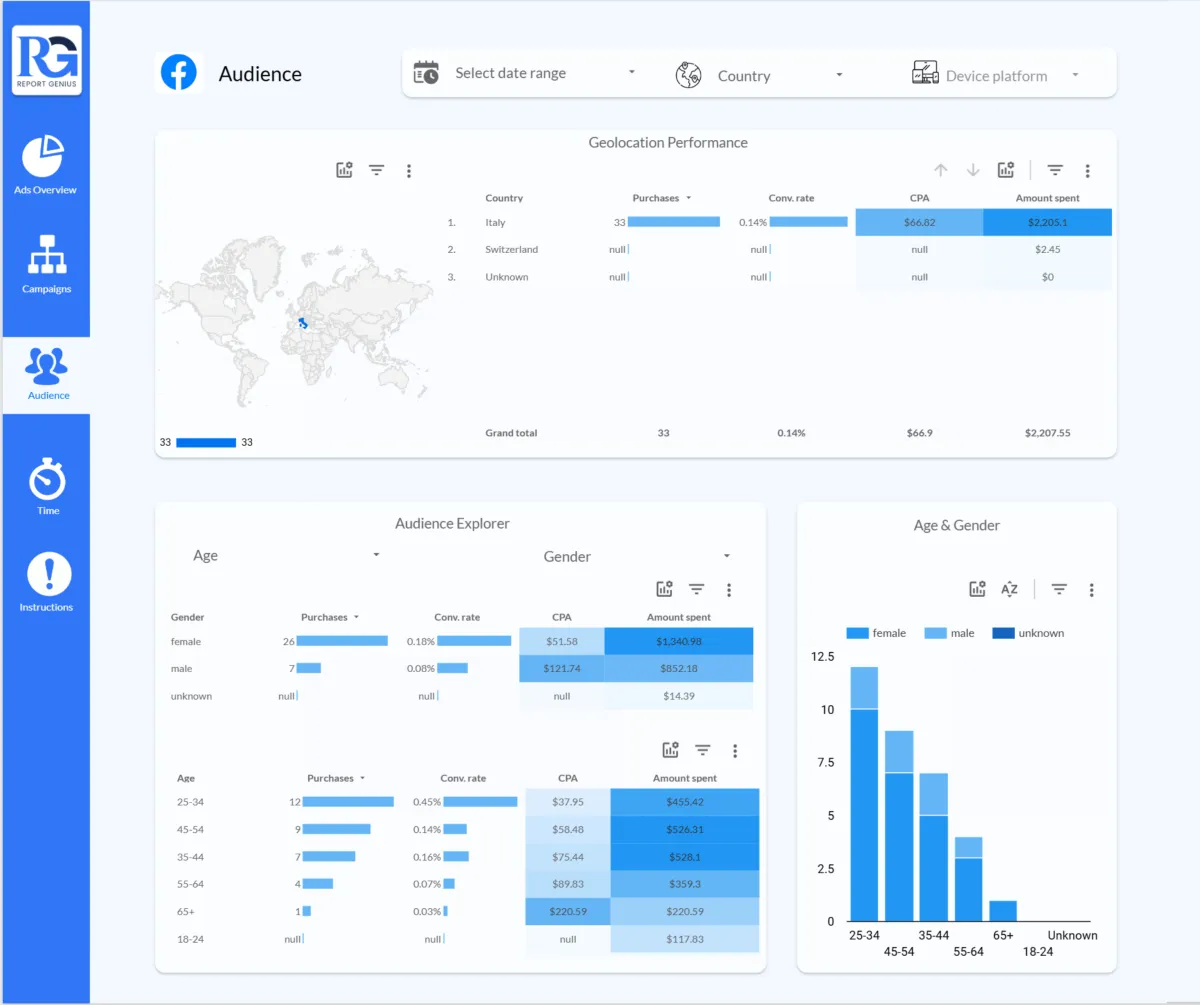
✅ Audience Analysis
Understand which audiences drive the best results:
Performance by age, gender, and country.
Cost-efficiency insights with CPA and conversion rate by demographic group.
Visual breakdown of audience segments to guide ad targeting and messaging.
✅ Platform Comparison
Track performance across Facebook, Instagram, and other placements:
See which platforms generate the most purchases and engagement.
Easily compare performance share by platform using intuitive visuals.
Optimize your budget allocation with platform-level CPA and ROI insights.
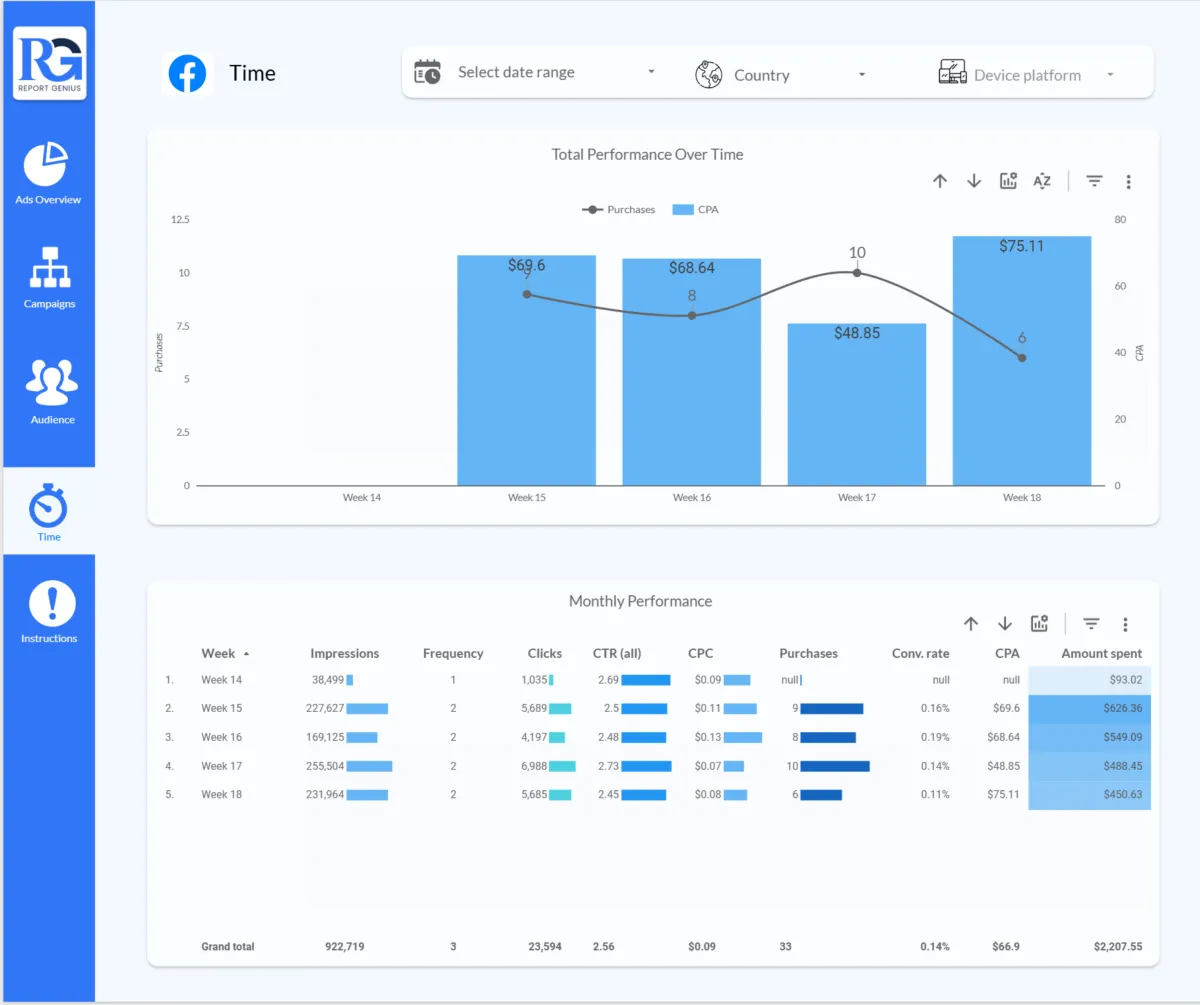
✅ Time-Based Ad Trends
Visualize how your campaigns evolve over time:
Weekly trends in clicks, impressions, purchases, CPA, and conversion rate.
Spot high-ROI periods and understand campaign lifecycle performance.
Track frequency and ad fatigue indicators over weeks.
📊 Metrics & Dimensions Included
Metrics:
✅Impressions
✅Clicks
✅CTR (Click-Through Rate)
✅CPC (Cost per Click)
✅CPA (Cost per Acquisition)
✅Amount Spent
✅Conversion Rate
✅Purchases
✅Frequency
✅% Change & Absolute Change (vs. previous period)
Dimensions:
✅Campaign Name
✅Campaign Objective (Sales / Traffic)
✅Platform (Facebook / Instagram)
✅Country
✅Device Platform
✅Gender
✅Age Group
✅Week / Month (for time-based analysis)
✨ Custom Metrics (Exclusive to This Template!)
Campaign Mining Table: Combine purchases, CPA, and ROI in one view.
Weekly Frequency Monitoring: Identify if audience fatigue is setting in.
CPA Heatmaps by Demographic: Instantly detect costly segments.
Performance vs. Previous Period Line Charts: Quick visual comparison to past results.
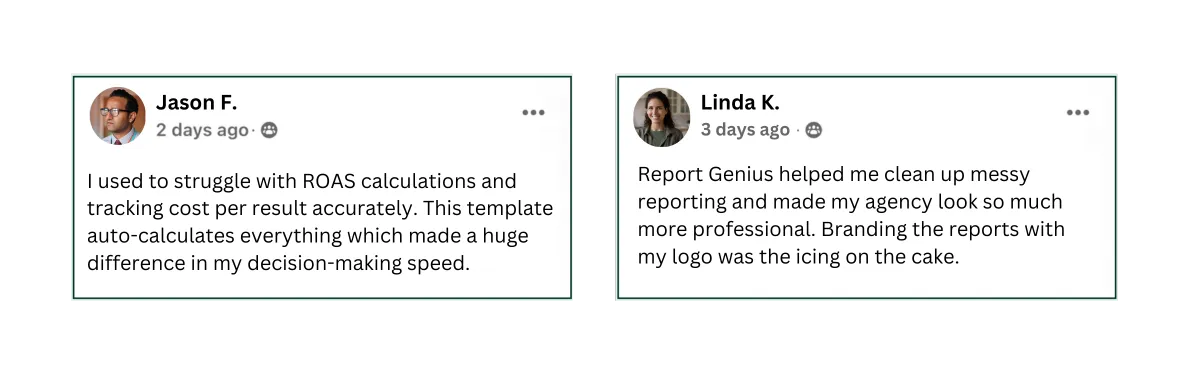
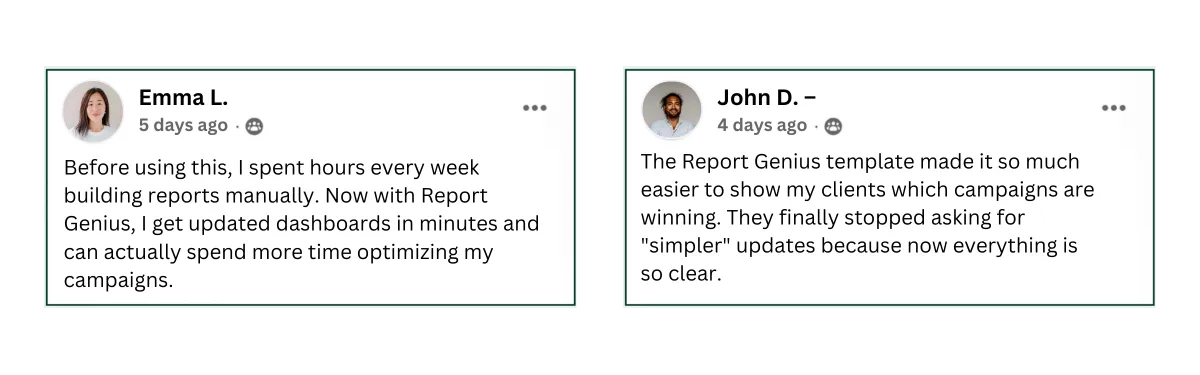
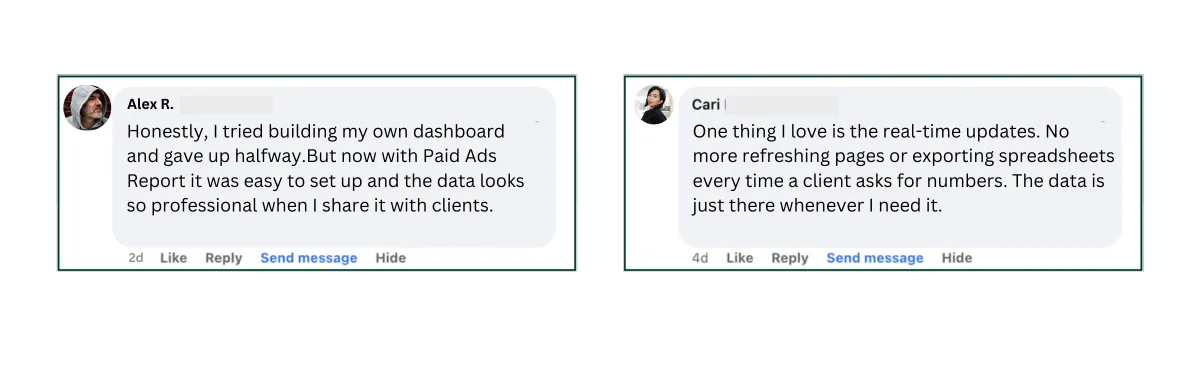
Our Client Reviews
Get Access to
Facebook Ads Report Template
Download, connect and use report template - Save time and skyrocket your campaign performance!
Pay Once. Use Forever
👉 Price: $199 Only
Limited-Time Offer!
🔗Connector Required
💵 Connector Cost: Free
🔒 Secure Checkout
Your information is 100% secure.
Payments are encrypted and safe.
⚠️Please note:
This is a one-time digital purchase and is Non-Refundable.
Privacy Policy | Terms & Condition
Copyright: Start and Grow